| Stemplot |
|---|
 |
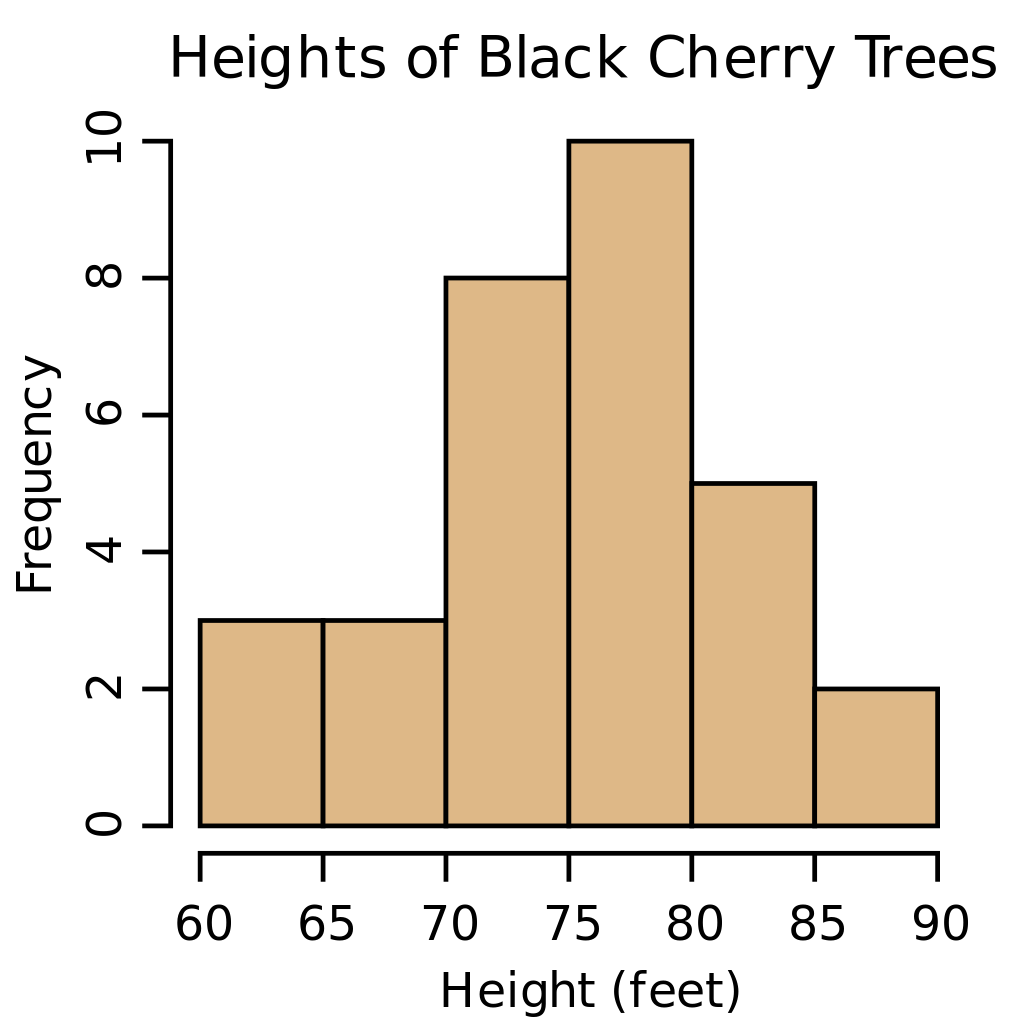
| Histogram (bar graph) |
|---|
 |
| Frequency Polygon (line graph) |
|---|
 |
Measures of Location
-
Quartiles divide datasets into four equal quarters
-
Percentiles divide datasets into hundredths
- where =index, = percentile, =total datapoints
- where =datapoints from bottom to datapoint (exclusive), =datapoints equal to measured datapoint, =total datapoints
-
Median refers to the middle datum in an ordered dataset (simple average of two middle points if even number of data)
-
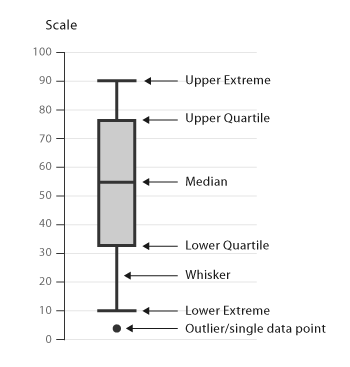
Interquartile range (IQR) refers to the spread between the first and third quartiles
- Outliers are from the 50th percentile (median)
Box Plots
 |
|---|
Measures of Center
-
Mean refers to the simple average
- is the sample mean
- is the population mean
-
Median refers to the middle value
-
Mode refers to the most frequent value (a dataset with >1 mode is bimodal)
Law of Large Numbers
as sample size increases.
Sampling Distributions
- Sampling distributions show probability of every result for a statistic from a large sample
- Statistics are calculated from samples ( is a statistic from a sample that estimates )
Grouped Frequency Tables
- The mean of a grouped frequency table can be calculated as where =interval frequency and =interval midpoint
Skewness
- Symmetrical distributions have the same mean and median
- Left-skewed distributions have a longer left tail (mean < median)
- Right-skewed distributions have a longer right tail (mean > median)
Measures of Spread
Standard Deviation
-
Standard deviation measures how far values are spread from the mean
- is the sample standard deviation
- is the population standard deviation
-
Deviation refers to the difference between some number and the mean ( or )
-
Variance refers to the average of the square of the deviations
- Sample variance:
- Population variance:
- Therefore, standard deviation is the square root of variance
Sampling Variability
- Sampling variability refers to how much a statistic varies between samples
- Standard error of the mean is a standard deviation that measures sampling variability ()
Comparing Values
- The -score is a metric that compares values from different datasets by standard deviations
- Sample: ,
- Population: ,
Chebyshev’s Rule
- For any dataset regardless of distribution
- 75% are within 2 SD
- 89% are within 3 SD
- 95% are within 4.5 SD
Empirical Rule
- For symmetric, bell-shaped distributions
- 68% are within 1 SD
- 95% are within 2 SD
- 99% are within 3 SD